TL; DR, I aimed to shoot Lua but sniped Google instead.
Making A Weapon Language To Surpass Metal Gear Lua Script
I’m reviving my toy language Elyra, because I recently had the thought that I wanted something better than Lua to integrate into game engines without the pains of JavaScript or Python integration. I also wanted to delve more into learning about compilation techniques and optimization, and this scratched that itch.
Having read the original Lua developer paper on the implementation of Lua 5.0, I understand exactly where they’re coming from in the 2003 computing perspective. Unfortunately, we are far closer to 2033 than 2003, and compiler theory has definitely evolved. Fortunately, if I want to match the performance of Lua’s compiler, this gives me a lot of headroom for more features or optimizations.
So how I am approaching the problem starts with some basic logic. In most normal programs, you have the axes of throughput and latency. Throughput is how much calculations can you do in a time frame, and latency is how much time it takes to get a result. Sometimes you can make optimizations that increase throughput and decrease latency, which is generally alluded to as “efficiency”. But often times getting to one extreme or the other sacrifices the other.
If you are a high frequency trader, it doesn’t matter if the code is doing the most throughput of transactions, it matters that your transaction is hitting the network in microseconds, otherwise you lose the trade and lose money. On the opposite, you don’t care how long it takes to submit a queue to a super computer, you just care that it does all the operations you requested in your simulation of the matrix when it hits the compute cluster as fast as possible; the time from submit to starting the computation is probably irrelevant to the customer unless that latency becomes so absurd that it is a measurable percentage of the time for the calculation.
However, in a compiler and JIT, the speed of getting from source to the first line executing is defined as the latency, but this is bound by the throughput itself. You need to get all of your code compiled and into the JIT as fast as possible, which implies that you process the code as fast as possible. In this sense, the axes are aligned. I want Elyra to be an Ahead of Time (AoT) compiled language as it allows caching and other transformations, while still being fast enough to be able to be compiled directly at runtime.
A compiler is a simple pipeline:
- Source Code goes into the Tokenizer, becomes Tokens
- Tokens go into the Parser, becomes a Parse Tree (or AST)
- Parse Tree goes through Semantic Analyzer, becomes an IR
- IR goes through optimizer and code generator, becomes Machine Code
Every stage then must take as little time as possible, and winning in each compounds throughout the program, which means the highest throughput possible. How can we achieve that?
Data Oriented Design
Of course I’ve seen Mike Acton’s Data Oriented Design talk at CPPCon 2014 online, and I was introduced to the concept by Zig’s BDFL and Creator Andrew Kelley and his talk at Handmade Seattle. I was also present for a similar talk by Matthew Lugg at Software You Can Love Milan 2024 in the theatre (with no air conditioning during summer, mind you).
Data Oriented Design is the focus on viewing programming as a means of shuffling and transforming data while also understanding and using the realities of computer caches, pipelines, and low-level CPU design and hardware to generate optimal code.
Before we get started… What is our target goal? It’s always useful to set targets.
Chandler Carruth, developer of the Carbon Language, set his goals as 10M Lines of Code tokenized and parsed, 1M Lines of Code semantic analyzed and lowered to IR, and 100K Lines of Code output via LLVM to machine code. These are measured as lines of code per second per core. (In the context of Chandler’s talk, this is an aspirational goal, not a hard deadline and depends on hardware)
If it’s good enough for Google, it’s good enough for me.
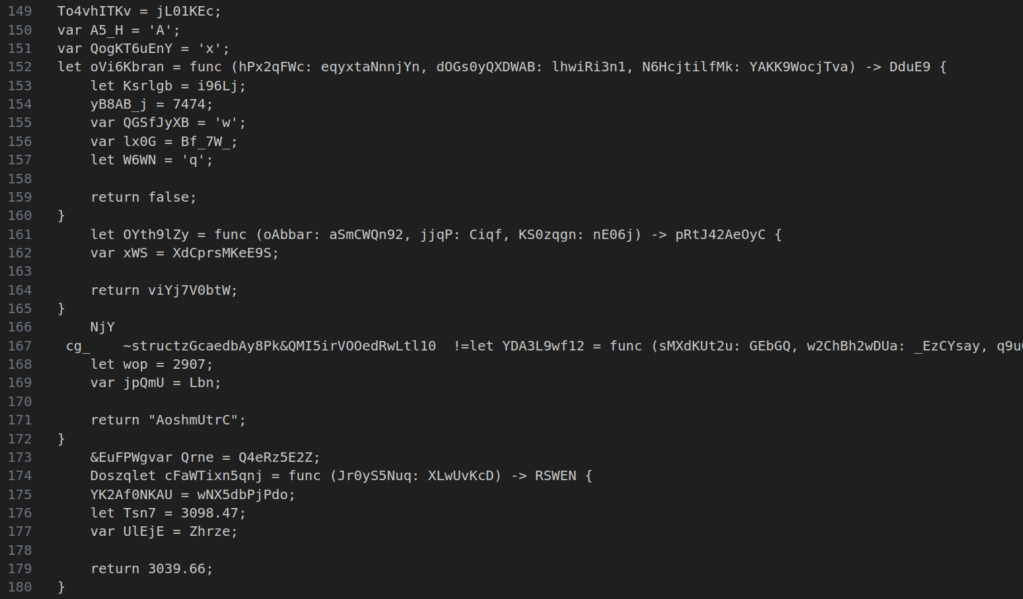
Quick example of what Elyra will look like:
# Function declaration
let add = func(a: i32, b: i32) -> i32 {
    return a + b;
}

# Partial function application
let add5 = add(5);

# Trait definition
let MyTrait = trait {
    sum: i32,

    printSum: func() -> {
        # Some placeholder exposed by VM
        builtin.print(printSum)
    }
};

# Structure with trait
let MyStruct = struct (MyTrait) {};

var instance = MyStruct {
    .sum = 0,
};

# 8
instance.sum = add5(3);
instance.printSum();
How Lua Tokenizes
First, let’s define what a Token even is. A token is just a string or character with syntactical meaning. Think of a ; , keyword , or an identifier like foo. Tokenization or lexing then, is the breakdown of source code into tokens.
Lua defines a token (from llex.h on current development branch) as:
typedef union {
  lua_Number r;
  lua_Integer i;
  TString *ts;
} SemInfo;  /* semantics information */

typedef struct Token {
  int token;
  SemInfo seminfo;
} Token;
If this code isn’t sinful then I don’t know what is. Basic compiler struct layout logic applies here: int is usually 32-bits, even on a 64-bit compiler. SemInfo is a union, and each member of this could be 32 or 64 bits. In the case that it’s 64 bits, we now have a struct whose alignment is 64 bits, and therefore that int entirely loses us 32 bits to padding in the struct. Let’s also mention that the number of defined token types will never saturate 32 bits.
Another issue lies with the inclusion of the SemInfo union; Is it even necessary to package this with every single Token? For example, there’s no data stored by TK_AND (the word and) because you already know what it is; it cannot store any other information.
Lua was created in a time during the late 90s and early 2000s that the word “locality” in the existing compiler literature usually meant locality in the source file reading from disk to the final result. This was pragmatic because you didn’t have that much memory to store your tokens or tree in and it was better to reclaim as much as possible. This can also be called the lazy model of the compiler.
While pragmatic for the time, this is definitely obvious in luaX_next, which is a token streaming function. The parser will take a token from a buffered context and immediately consume it. By default this would be a file. This destroys any locality of reference and likely results in a lot of inefficient use of the L1 cache when doing parsing.
I wrote a quick micro benchmark on Lua from the master branch in C++ running on 8MB of Lua Source generate via python. I gave it a couple advantages working with the internal API such as loading all of the memory of the file at once, and not doing parsing, just tokenization, which is obviously way better on L1 cache. I added the values to a pre-allocated std::vector<Token> (to not have alloc get called) to simulate storing the tokens in the hot loop, to make my comparison like-for-like. (I’m really trying to give it the best chance!)
Lua sets a solid baseline here at 41.3 Million tokens per second, 9.1 Million lines of code per second, with a throughput of 146.5 MB/s of source input. Remember though that the goal was tokenize and parse at 10 Million lines of code per second per core.

Benchmark was ran on an AMD Ryzen 9 9950X with 64GB of 6000MT/s CL 36 RAM on Ubuntu 24.04. This single-core benchmark gets the benefit of the full max 1 core boost clock.
Starting the Tokenizer
I’m going to write my compiler and JIT in Zig as it has trivial compilation to C for extended platform support, and is also a great experience as a better-than-C C. Buy more stocks of $ZIG, now!
Another noteworthy exemption here is that I want the code to be roughly cross-platform, so I don’t want to tap into AVX or SIMD explicitly. If the compiler does it for me, I’ll take it, but if it doesn’t, then I won’t be that bothered. Additionally I don’t want to use any CPU-specific instructions or derivatives like ctz and clz. The most will be optimizer hints like @branchHint or indicating that a variable should be @prefetch in a certain context, which are both nop if not supported.
I made a simple container for the program code and file name per compilation unit / module called SourceObject
const SourceObject = struct {
    text: []const u8,
    filename: []const u8,
    allocator: std.mem.Allocator,

    // functions to load from file, memory
};
This code didn’t really provide me anything more than reaffirming the marketing on my Samsung NVME Drive was indeed correct.
Let’s consider all the things a Tokenizer or Lexer does; First and most obviously it looks at the current character or set of characters and transforms that into a token. For example it sees != and translates that into Token.NotEquals. It also needs some way of storing where the token is, like the line number and column — if there’s a parsing error, I want to look up where the token is and print it. Additionally, now is probably a good time to store the pointer to where we are in source code. And we should also take literals like strings, numbers, and even identifiers, and store those. Maybe we should even encode length
So we have the following variables:
- Kind
- Position
- Source Location
- Literals / Identifiers
A naive tokenizer would simply use a struct approximating something like this:
const Token = struct {
    position: *u8,
    kind: TokenEnum,
    line: u32,
    column: u32,
    literal: union (Tag) {
        Identifier: IdentStruct,
        Float: f64,
        Int: u64,
        String: []const u8
    }
};
This is an abomination, it takes up a huge number of bytes, 38, or 40 with padding. What if I told you we could encode that in 4 bytes?
Efficient Token Packing
First, drop the line and column — the source location already tells you that — you just go from the start of the source and count your \ns and then how many characters you just moved forward. It’s also trivially cheap to just add a secondary auxiliary buffer containing the token positions of the last line break as an index into the token array, such that you can do a linear search on that array of the count of positions before yours, then calculate the column value if it becomes necessary to support that.
Second, the source location shouldn’t be a full pointer — you will not be loading 256 TB of source code in my language (nor 4GB for that matter). The whitespace can be packaged into influencing the kind enum. This doesn’t need to be explicitly packed in.
Finally, as for literals, we can do an optimization called interning — where we turn everything into integers, and store these in a secondary array. This can technically be multiple arrays, what matters is that we know that this will be sparsely populated compared to the raw number of simple tokens like (,{.}+-/*. Often times, we don’t even need to really reference this array, so it’s going to be in the slow path anyways, while the tokens need to be in the hot path.
What we’ll do is maintain a secondary list of this data corresponded to token identifiers. For example:
// Two 32-bit values, first is token index
// second is valMap index
var tokenValMap: []u64 = 0;

// These are either f64 or u64 and are de-duplicated
var valMap: []u64 = 0;

for (tokens, 0..) |t, i| {
    if (t.kind == .Float) {
        var fval = for (tokenValMap) |pairs| {
            if (pairs >> 32 == i)
                break valMap[pairs & 0xFFFF_FFFF];
        } else @panic("Not found!");
    }
}
The same can be done with strings as well, for even greater cost savings.
So what does my proposed hyper-optimized token look like?
const Token = packed struct (u32) {
    kind: u8,
    position: u24,
};
Of course, now we also have a few extra arrays that we keep around too which will be covered later. Zig will automatically shift / mask for us, and with the way we’re indexing, this should be fine.
Setting the Baseline
Let’s do the most trivial tokenizer ever!
var i: u24 = 0;
while (text_ptr < text_end) : ({text_ptr += 1; i += 1}) {
    try tokens.append(.{
        .kind = text_ptr[0],
        .position = i,
    });
}
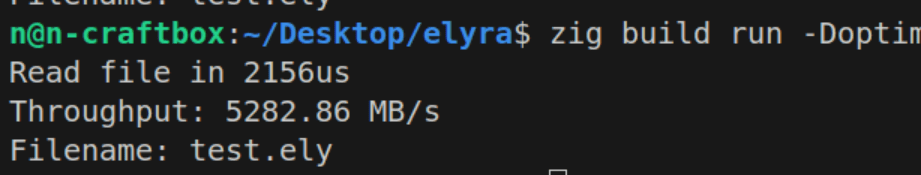
This is effectively a spicy memcpy. I created a script in Python to generate valid-ish looking Elyra code.
We can run it and see some decent results.
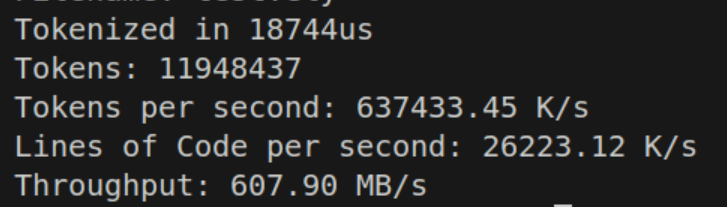
26 million lines of code per second sounds impressive, and so is 637 million tokens per second. But if you’re seeing that throughput number, we’re somehow nearly 10 times slower than my NVME disk on memcpy? If this is the best we can do, what are we even fighting for?
But of course there’s a few things we need to look at in the current implementation. In try tokens.append there are two branches, one obvious and one implicit. The obvious branch is the error case of it trying to allocate more memory and failing. The compiler already marks this as a cold path, so we probably don’t feel it.
The more pressing matter is the internal logic of append(). Thankfully, the Zig Standard Library Source is far more readable than something like C++. We can easily find ArrayList(T).append() here. Through multiple function calls that get inlined, it pretty much boils down to a simple dynamic array:
if (self.items.len == self.capacity) {
    self.capacity *= 2;
    // Realloc
}

const idx = self.items.len;
self.items.len += 1
self.items[idx] = value;
Now that if might be expensive if we’re getting our buffer resized frequently, and adding a bunch of latency each time with a realloc. So there’s two strategies here. The more practical one is to start high with some heuristic based on data. You might notice that per X number of source input bytes you get a ratio Y number of tokens. This could be exploited to minimize the chances of hitting the bad side of the if, training the branch predictor to guess correctly. It also reduces the number of allocations necessary along some curve, and syscalls are expensive. For example, we can initialize our token array like so with a preallocation:
var tokens = try std.ArrayList(Token).initCapacity(
allocator,
source.text.len / 2,
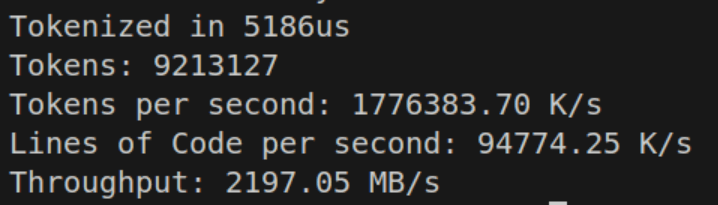
);This results in a pretty massive speedup to about double the speed. Also we can get rid of any excess by doing tokens.shrinkAndFree() at the end, bringing the buffer back into the right size.

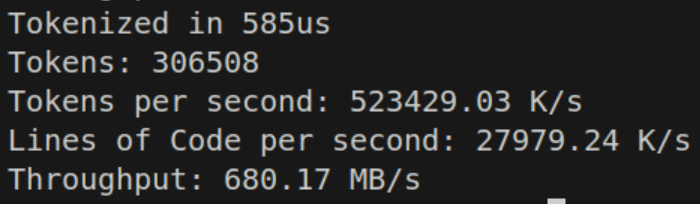
Still at this point, I’m not satisfied. If we’re gonna hit this heuristic hurdle, we might as well just preallocate the entire thing. And we get another bump

But if we preallocated everything, we could also remove the if check entirely, and in fact, even the try. If we use tokens.appendAssumeCapacity() we can get blazingly fast.

That’s obviously crazy fast! But the one issue you might run into is going to be RAM usage. Tokenizing a file temporarily will spike your memory usage by @sizeOf(Token) * source.len before settling back down from the shrink. In the context of Elyra, where I’m expecting the amount of code to be at worst probably 1MB, this is probably fine. I will continue comparing this with the “slow” implementation will also include a heuristic memory pre-allocation of source.len / 4. This probably can be improved with a real dataset of real code.
Skipping Whitespace
In our application, we don’t care about whitespace when we come across it outside of possibly unary / binary deduction logic. Thus we can implement skipping. One might think that the easiest thing to do then is just a simple if, or even a switch statement.
while(text_ptr < text_end) : (text_ptr += 1) {

    if (text_ptr[0] is a whitespace)
       continue;
}
And we see our throughput crash as a result:

But can we do better? Well maybe a switch?

Margin of error.
But how can we possibly do this any faster? The answer is branchless programming. Fundamentally, we want to kind of calculate both sides of the branch — the case where we do something, and the case where we don’t. This way we can mathematically deduce the answer without a branch, and as we’ve seen, branches are expensive.
In this case, we actually need to simulate the case we do something and the case where we don’t do something to the array list. Basically then, I want to “delete” an entry off the array list if it’s a space, and the entry is garbage, or I want to add an entry. So we can figure out how to do this by doing each boolean condition and then multiplying right?
const is_space = text_ptr[0] == ' ' or text_ptr[0] == '\n'
append(&tokens, tk);
token.items.len -= 1 * is_space;
Huh? How did we get the same performance? In every single case, we’ve just basically done the exact same set of operations and rendered down to the same machine code. So is that it?
Well let’s try a slightly smarter tactic. We can do all of the checks in one operation. To do this, we construct a mask (or a set of masks) and then shift the bits over and check.
const space_mask = [_]u32 {1 << '\t' | 1 << '\n' | 1 << 'r', 1 << (' ' - 32), 0, 0}
const is_space = space_mask[c >> 5 & 3] >> @truncate(c) & 1;
What we’ve basically done is made a mask of the ASCII values we care about on the bit offsets, then we shift over by the number of bits to grab and we end up getting whether or not we are a space character or not.
And this time, we see that the performance impact is much lower! So why does this work? Shouldn’t at least the other branchless example have compiled down similarly?
Using Godbolt, here is the compiled code:
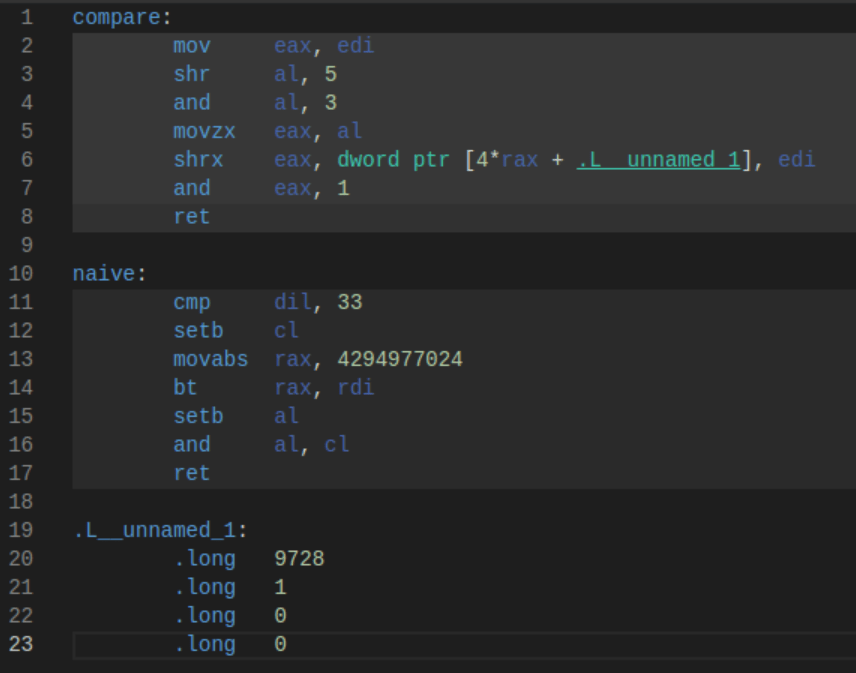
So why is compare (the masked version) so much faster? The answer lies in the operations themselves. In the naive version, cmp is a slow operation and it introduces a subtle flag dependency. The CPU pipeline must let the flag get set. movabs is also a relatively slow operation, and the setb is used to do a set bit operation. If you’re wondering if removing 33, the space character, helps, it still runs only about 20% better, and now we have semantically incorrect code.
Compare that to the masked version, which simply does 4 bitwise operations and a move, the fastest instructions your CPU can do. In fact, the CPU likely pipelines these in such a way that all of them run at almost the same time.
Of course littering our code with these masks might be rather annoying, so Zig allows us to just create the masks with a generalized function at compile time and then use them. We can also force the check itself to be inlined, and we now have a very clean way of writing our branch mask sets. The use of u32 is to help the lower-end systems being targeted.

As for why our code is now slower than the empty example, this actually has to do with data dependency. Because the previous sample had no data dependency, items.len predictably grew by only one, we could pre-compute and add every token without caring if the previous was done yet, because it affected nothing. Now that items.len is less able to be predicted, we cannot get that same pipelining benefit. Unfortunately, this isn’t a case where a two-pass prefix sum (or three passes) will make things better, as I’ve tried and not found any success; the compiler can make even less assumptions about the indices being in any particular order. When do we get [[assume]] in Zig? /s (I’m not fully sure C++ [[assume]] is capable of using this hint, as a lot of assumptions passed into the C++ optimizer don’t do what you expect)
Identity Mapped Tokens
Because our tokens including single-character tokens, we can simply map these as the same value in our TokenKind enumeration. If we want to scan for the identity mapped tokens, we must also exclude potentially multi-character tokens like + % != and others. With our create_ascii_mask_array ‘macro’ we can auto generate the mask at compile time. And simply use it a parameter in append.

The performance isn’t terrible here, but we still notice a drop-off. This appears to be because the hot-loop is now generating a cmov for the .kind parameter. Beforehand it could simply just mov the value of c.

But if we want to Go Nowhere Faster, we have to check if doing a branch here is actually faster; in some cases, the branch predictor is faster than cmov Now those cases usually require the condition be predictable. The branch predictor is not our friend in tokenization as the input may as well be random.
And we find that doing an if expression does lower the throughput, though not by as much as you might suspect.
Now that we’ve started producing actual valid tokens, I thought it was about due time to also create some tests, to check my expected results. I also introduced Tracy, a real time, nanosecond-accurate tracing telemetry-based profiler. I seriously recommend using Tracy if you’re doing game development (frame & API profiling) or other compute-intensive tasks. Tracy integrates well with allocators for memory diagnostics as well.
Structural Change
Adding more and more cases to this while loop began seriously dragging my performance, to the point where I only ran on-par with my previous simple switch-case, which fell quite short of where I wanted to be. I however wondered if my switch case was failing to be optimized. So while running a ChatGPT-4.5 Deep Research query for fun on Lexer Designs, it came across this comment in Carbon’s Lexer.
Even in the early days of LuaJIT, the developers were running into the same problem where the C optimizer would never really hit the same level of the parallel case, but instead hit diamond-shape control-flow, and immediately have issues. This issue has seemingly remained the case in C, C++, Zig, and every other LLVM-language (citation needed).
So the solution? Tail calls, and a dispatcher table. This model shifts from a general loop that handles all possible conditions to many smaller functions that handle a specific condition. It’s easy to see how this could be faster. When you have a tail call, the compiler emits a single jump to your next function, resulting in no overhead bookkeeping of the stack, and this results in some nice performance gains, as we can do less work. This also lets the optimizer do more with the functions we’re returning.
But as with all things, measure!
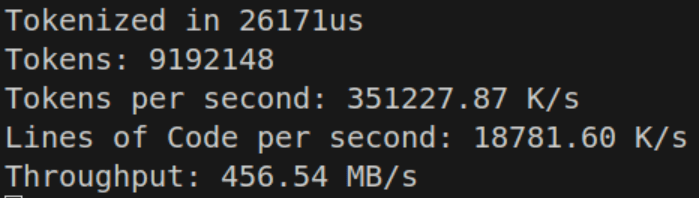
I wrote 3 implementations, one with a naive switch, one with a labeled switch-continue dispatch table, and another with a good ol’ array dispatch table. These handled single character and multi-character tokens.
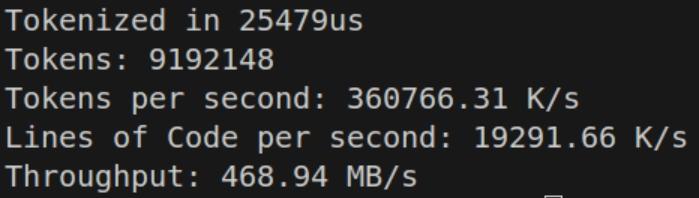
The labeled switch-continue performs respectably at 468.94 MB/s — on par with the purely tail-call optimized dispatch table.
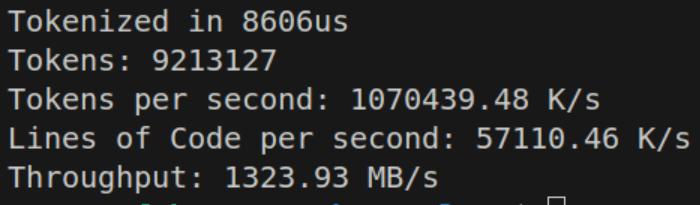
However the while-switch statement seems to perform just a bit better than the competition.

This might be because loop-unrolling is allowed to happen, or cross-branch switch optimizations occur. These don’t seem to be all that fast; maybe I can do a different structure using pre-calculated character tables.
The Weird
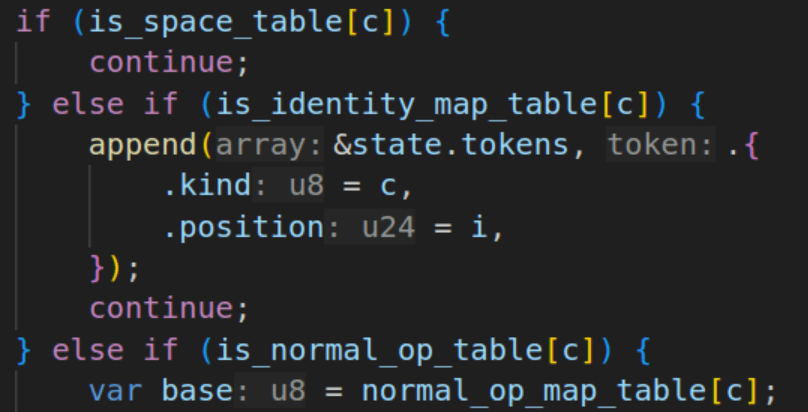
An if-else block seems to absolutely dominate the competition. It’s sorted by likelihood, and just works. It seems that sequential comparisons are actually beating a jump table in terms of branch prediction, or at minimum — they’re not worse. The benefit of a jump table is somewhat nullified if the CPU can’t utilize speculative execution, even if that execution isn’t always perfect. By moving the heuristic cases of the if statement around and some other tricks, the good-ol’ if statement is able to beat a dispatch table or switch case jump table. Using perf stat, branch predict misses went from ~10% down to 5%.
To actually do this in a way that is fast, I don’t just simply do a comparison like before if c == ' ' or c == '\n' ... Instead we precompute a u8 lookup table for all the different cases, and just look up the case. In this case, trying to do the mask seems to perform slower than just looking up the table, so the earlier solution is abandoned for now. If there are special starting values the base value is pre-calculated and entered into the lookup table. In the normal op table this includes something like %, which is the remainder. The value for that is at the address in the table, and to turn into %=, simply add one if the next value is =. That comparison is simple enough for the compiler to optimize.
Complex operators like the +, -, * which all have wrapping, saturated, and set-equal variants required creating a DFA via switch statement, which appears to work fine on simple math. Adding the remainder of operators and logic, we actually improve performance up to ~850-900MB/s.
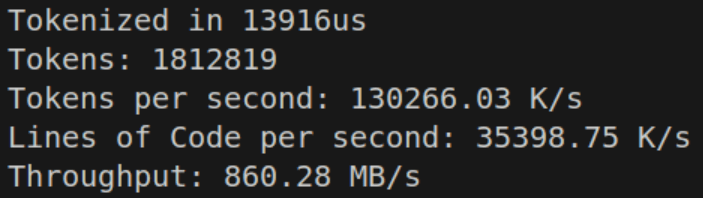
This is due to identifiers and multi-token characters reducing the total number of iterations of the loop, even though the loop becomes more expensive. We’re now finally amortizing some of our cost, which logically means we have a bit more wiggle room for performance.
This is actually where the cost of try append becomes somewhat equalized, with the heuristic len / 4, since the branch never gets called during runtime. I felt it okay at this point to no longer separate the memory limit code, and the performance is about the same, so sometimes you can have your cake (fast tokenize) and eat it too (low memory usage).
Keywords, Values, and Strings
For an identifier to be added, we must first determine whether it is an identifier or a keyword. If it is a keyword, we add the keyword value. Otherwise, we proceed with the identifier logic. For this, we just need a simple string lookup into a map. With Zig, we can optimize this at comptime with StaticStringMap.

Which is then declared as const kmap = KeywordMap.initComptime(KeywordPairs); Which can be used with an identifier to designate that the identifier is a keyword by simply calling kmap.get(identifier_slice). This is reasonably fast, and keeps us at about 600-650 MB/s. It’s worth noting that the testing code is VERY dense in identifiers.
Additionally I found myself wanting or needing to parse user data at a reasonable speed. At first I had planned to create an identifier table and string table which were both interned. I also wanted to handle integral and floating point values.
The issue I had with identifiers and strings was that it was simply easy to recall the values (go to token position, read until end), and trying to do set operations / hashing was destroying my loop performance. So I decided that it would be best to first identify all identifiers and then either recall as needed, or more likely, to perform string interning during the semantic analysis phase instead of now (pay the cost later). This is because the cost of string interning may be relatively high and the computer does not need it for the time being. Value interning though… is pretty cheap, in fact we can even store copies of the values — it just doesn’t matter.
With that decision out of the way, it became trivial to implement a lookup system — all I needed was token ID as a u32 and the corresponding index to look up. The token itself could be used to determine which table to lookup into. Simply search the array, find the token, return the index. The consumer takes the index and looks into the relevant side table for data. This is what was chosen for the Value table, which holds up to 64 bit integer and floating point data.

This along with the parsing logic for values cost a bit more, but only brings us down to ~600MB/s… and our tokenizer was… surprisingly complete. I know I skimmed the multi-character tokens a bit, and there’s certainly a few more optimizations I want to retry, but one goal of any personal engineering project that is unique to personal projects is the need to finish something.
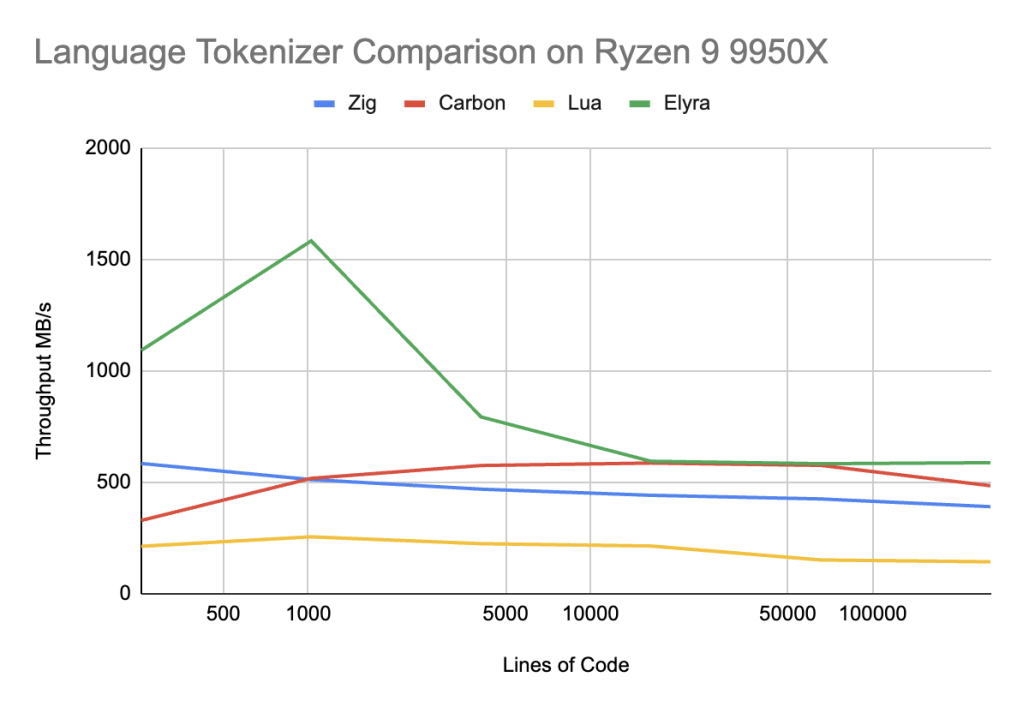
Benchmarking & Comparison
Benchmark speeds were based upon the format the Google Carbon’s benchmarks used as I found them to be clear and easy to make head to head comparisons with.
Elyra (main branch)
Ryzen 9 9950X CL36-DDR5-6000
| Total Lines | Time | Byte/s | Line/s | Token/s |
| 256 | 6us | 1091.54M | 41.08M | 162.70M |
| 1024 | 16us | 1583.39M | 62.60M | 248.24M |
| 4096 | 127us | 792.58M | 32.09M | 122.85M |
| 16384 | 677us | 593.50M | 24.19M | 92.39M |
| 65536 | 2763us | 582.75M | 23.71M | 90.67M |
| 262144 | 11003us | 587.13M | 23.82M | 91.02M |
Macbook Air M4 10C8G Unified Memory
| Total Lines | Time | Byte/s | Line/s | Token/s |
| 256 | 7us | 1078.30M | 34.83M | 162.98M |
| 1024 | 26us | 1148.23M | 38.57M | 181.80M |
| 4096 | 120us | 998.52M | 33.91M | 155.35M |
| 16384 | 671us | 721.54M | 24.39M | 111.78M |
| 65536 | 3001us | 644.41M | 21.83M | 100.29M |
| 262144 | 12383us | 625.82M | 21.17M | 97.37M |
Lua (main branch)
Ryzen 9 9950X CL36-DDR5-6000
| Total Lines | Time | Byte/s | Line/s | Token/s |
| 256 | 23.81us | 211.77M | 12.20M | 58.76M |
| 1024 | 71.59us | 254.23M | 15.48M | 71.48M |
| 4096 | 308.77us | 223.48M | 13.90M | 63.00M |
| 16384 | 1277us | 212.99M | 13.25M | 60.17M |
| 65536 | 6995us | 150.35M | 9.38M | 42.42M |
| 262144 | 29578us | 142.24M | 8.86M | 40.14M |
Macbook Air M4 10C8G Unified Memory
| Total Lines | Time | Byte/s | Line/s | Token/s |
| 256 | 22us | 132.85M | 8.24M | 37.04M |
| 1024 | 68us | 185.82M | 11.61M | 52.75M |
| 4096 | 377us | 191.23M | 11.91M | 53.91M |
| 16384 | 1132us | 193.03M | 12.06M | 54.45M |
| 65536 | 5510us | 179.69M | 11.21M | 50.64M |
| 262144 | 24509us | 169.97M | 10.59M | 47.96M |
Carbon (main branch)
Ryzen 9 9950X CL36-DDR5-6000
| Total Lines | Time | Byte/s | Line/s | Token/s |
| 256 | 16us | 327.93M | 12.14M | 68.55M |
| 1024 | 62us | 517.00M | 15.58M | 91.53M |
| 4096 | 246us | 574.63M | 16.31M | 96.63M |
| 16384 | 1043us | 585.54M | 15.63M | 92.77M |
| 65536 | 4390us | 575.15M | 14.91M | 88.54M |
| 262144 | 21133us | 483.65M | 12.41M | 73.65M |
Macbook Air M4 10C8G Unified Memory
| Total Lines | Time | Byte/s | Line/s | Token/s |
| 256 | 25us | 208.44M | 7.72M | 43.57M |
| 1024 | 82us | 395.21M | 11.91M | 69.97M |
| 4096 | 568us | 249.66M | 7.09M | 41.98M |
| 16384 | 1515us | 403.09M | 10.76M | 63.86M |
| 65536 | 5292us | 476.98M | 12.37M | 73.43M |
| 262144 | 22191us | 460.52M | 11.81M | 70.13M |
Zig (0.14)
Ryzen 9 9950X CL36-DDR5-6000
| Total Lines | Time | Byte/s | Line/s | Token/s |
| 256 | 13us | 583.72M | 18.44M | 191.76M |
| 1024 | 61us | 511.34M | 16.61M | 167.04M |
| 4096 | 271us | 468.34M | 15.08M | 152.53M |
| 16384 | 1154us | 440.78M | 14.19M | 143.64M |
| 65536 | 4789us | 424.43M | 13.68M | 138.12M |
| 262144 | 20854us | 389.63M | 12.57M | 126.77M |
Macbook Air M4 10C8G Unified Memory
| Total Lines | Time | Byte/s | Line/s | Token/s |
| 256 | 12us | 654.02M | 20.66M | 214.86M |
| 1024 | 52us | 595.69M | 19.34M | 194.60M |
| 4096 | 227us | 559.73M | 18.02M | 182.99M |
| 16384 | 969us | 524.88M | 16.90M | 171.04M |
| 65536 | 3996us | 508.71M | 16.40M | 165.55M |
| 262144 | 16248us | 500.06M | 16.13M | 162.71M |
Discussion
Elyra successful beats Lua by a wide margin, up to 3-4X faster, but to be completely honest, that is not entirely a surprising result — Lua is not attempting to be fast. To compare to languages whose goal is optimized compilation speed, maybe we get a better result.
On x86 in the 256-4096 lines of code range, Elyra beats Carbon by a factor of 50-200%, which is an amazing win, and trades blows evenly with the rest of the line ranges for Google Carbon. Elyra also outperforms Zig by 75-200% in the 256-4096 lines of code range and ~25% in the remainder of the range.
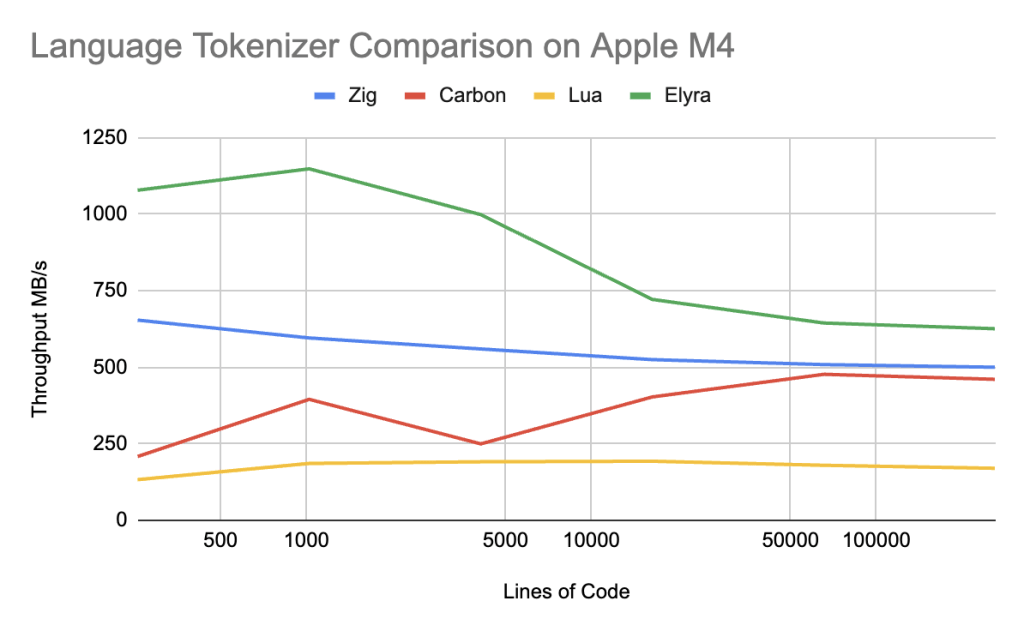
On Apple Silicon, Elyra handily wins over Carbon by 35-400% across ALL ranges. Elyra still beats Zig but only by 100% in the 256-4096 lines of code range and again ~25% in the remainder of the range.
Performance conclusions about Carbon seem to indicate there is a issue in the L1-L2 cache range that is only sorted out in the L3 cache range. Carbon and Zig are slightly more complex tokenizers, but Zig outperforms Carbon easily, indicating that Carbon has unique issues to its Tokenization strategy. I think the most likely issue is that the tail recursive dispatch tables are completely unpredictable and that a state machine like Zig, or Elyra’s simple “if” branches cause better branch predictor behavior, resulting in better speculative execution on x86 and Apple Silicon.
Of course now it becomes time to parse the grammar, and make sure we don’t lose any edges when it comes to that… which we’ll see in Part 2!
